June
Product analytics for B2B SaaS. Company-level insights, activation funnels, retention.
june.so ↗Interface Screenshots June

Showing 12 of 363
Which UI decisions are documented for June?
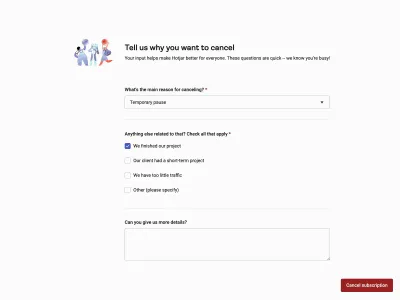
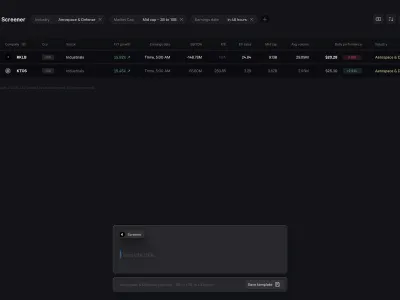
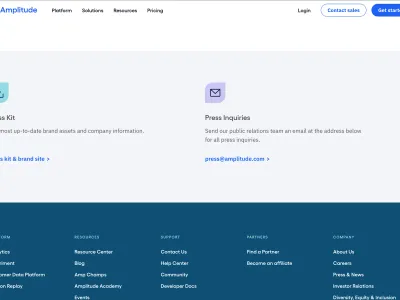
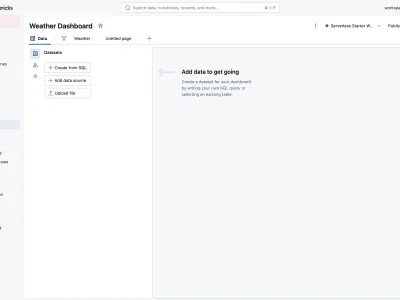
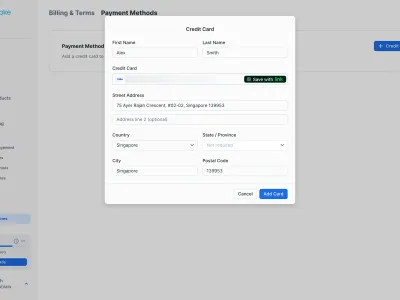
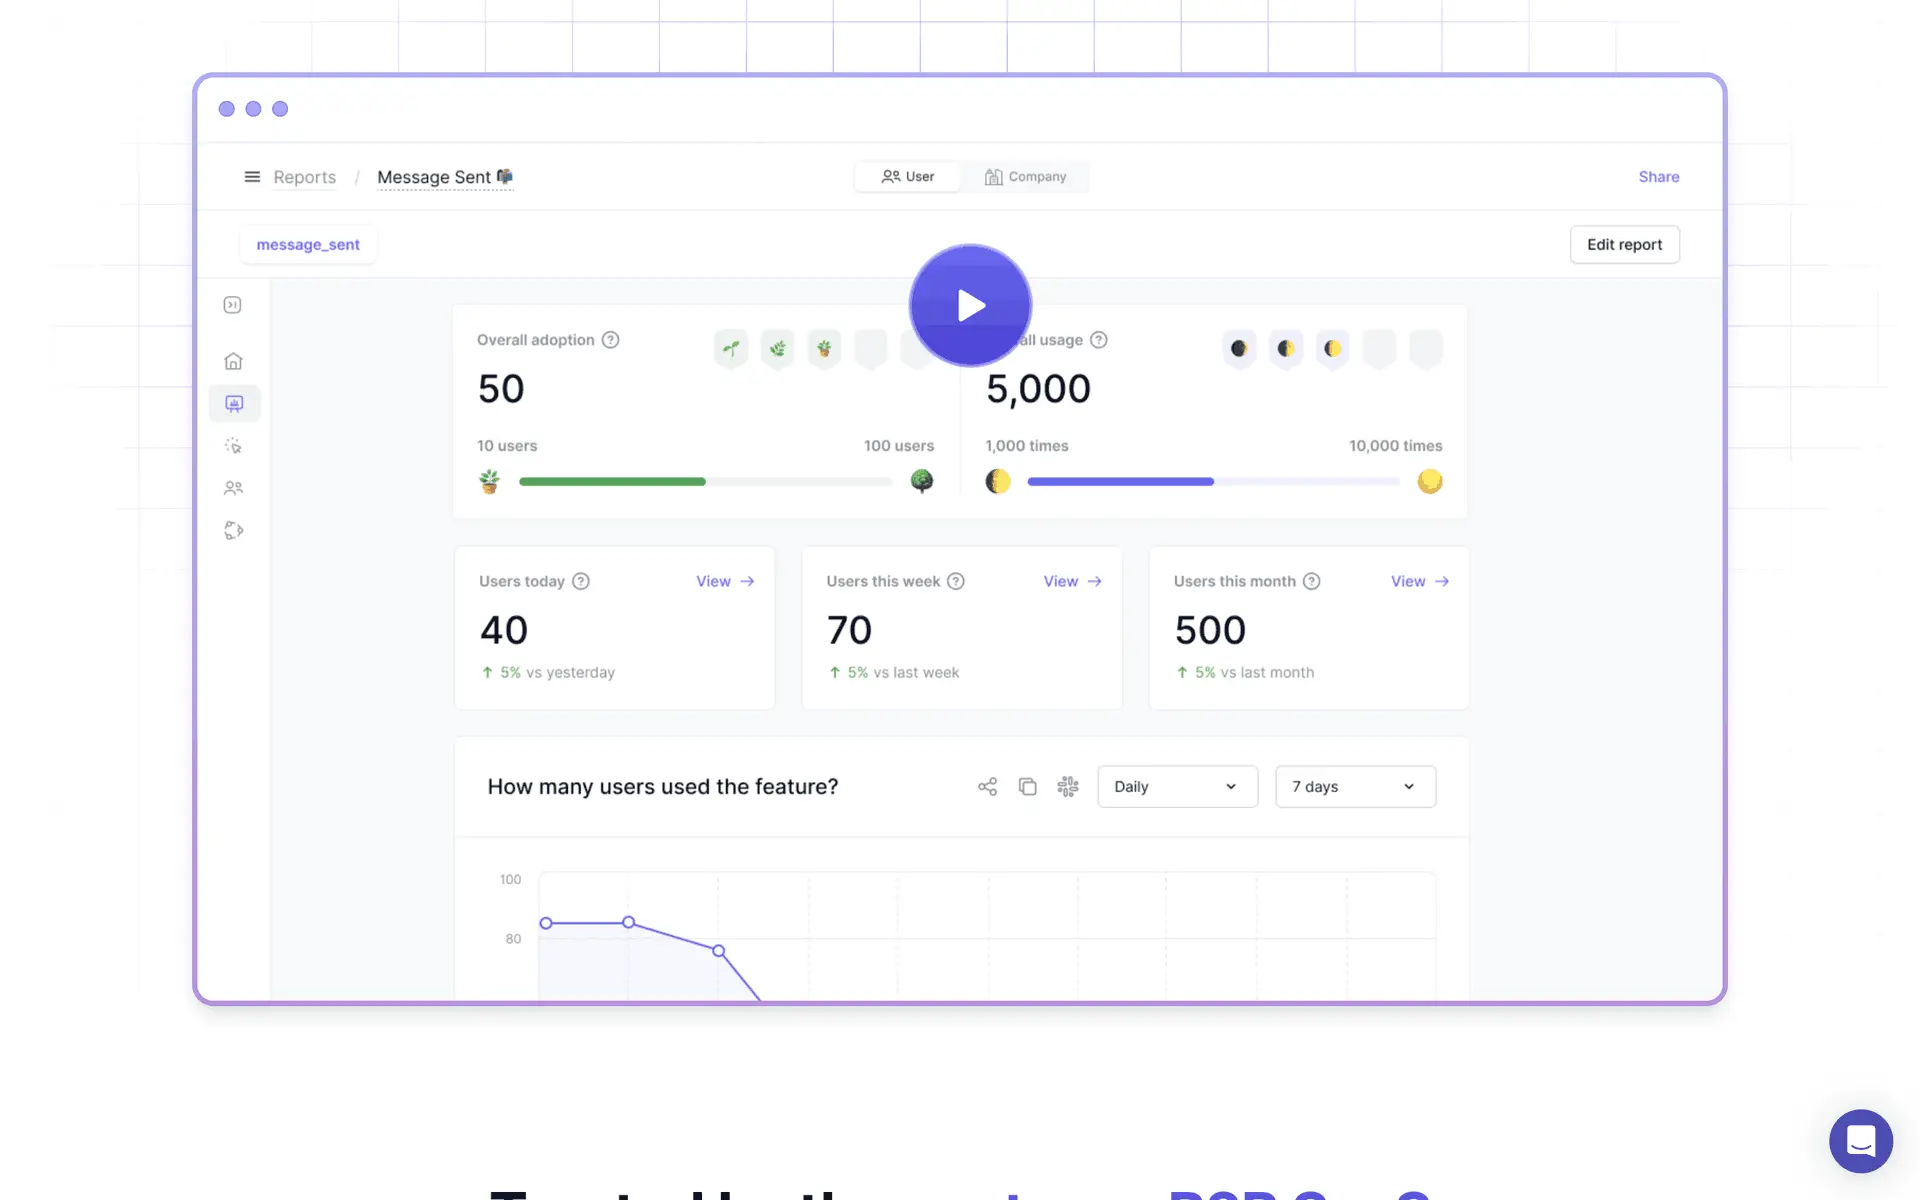
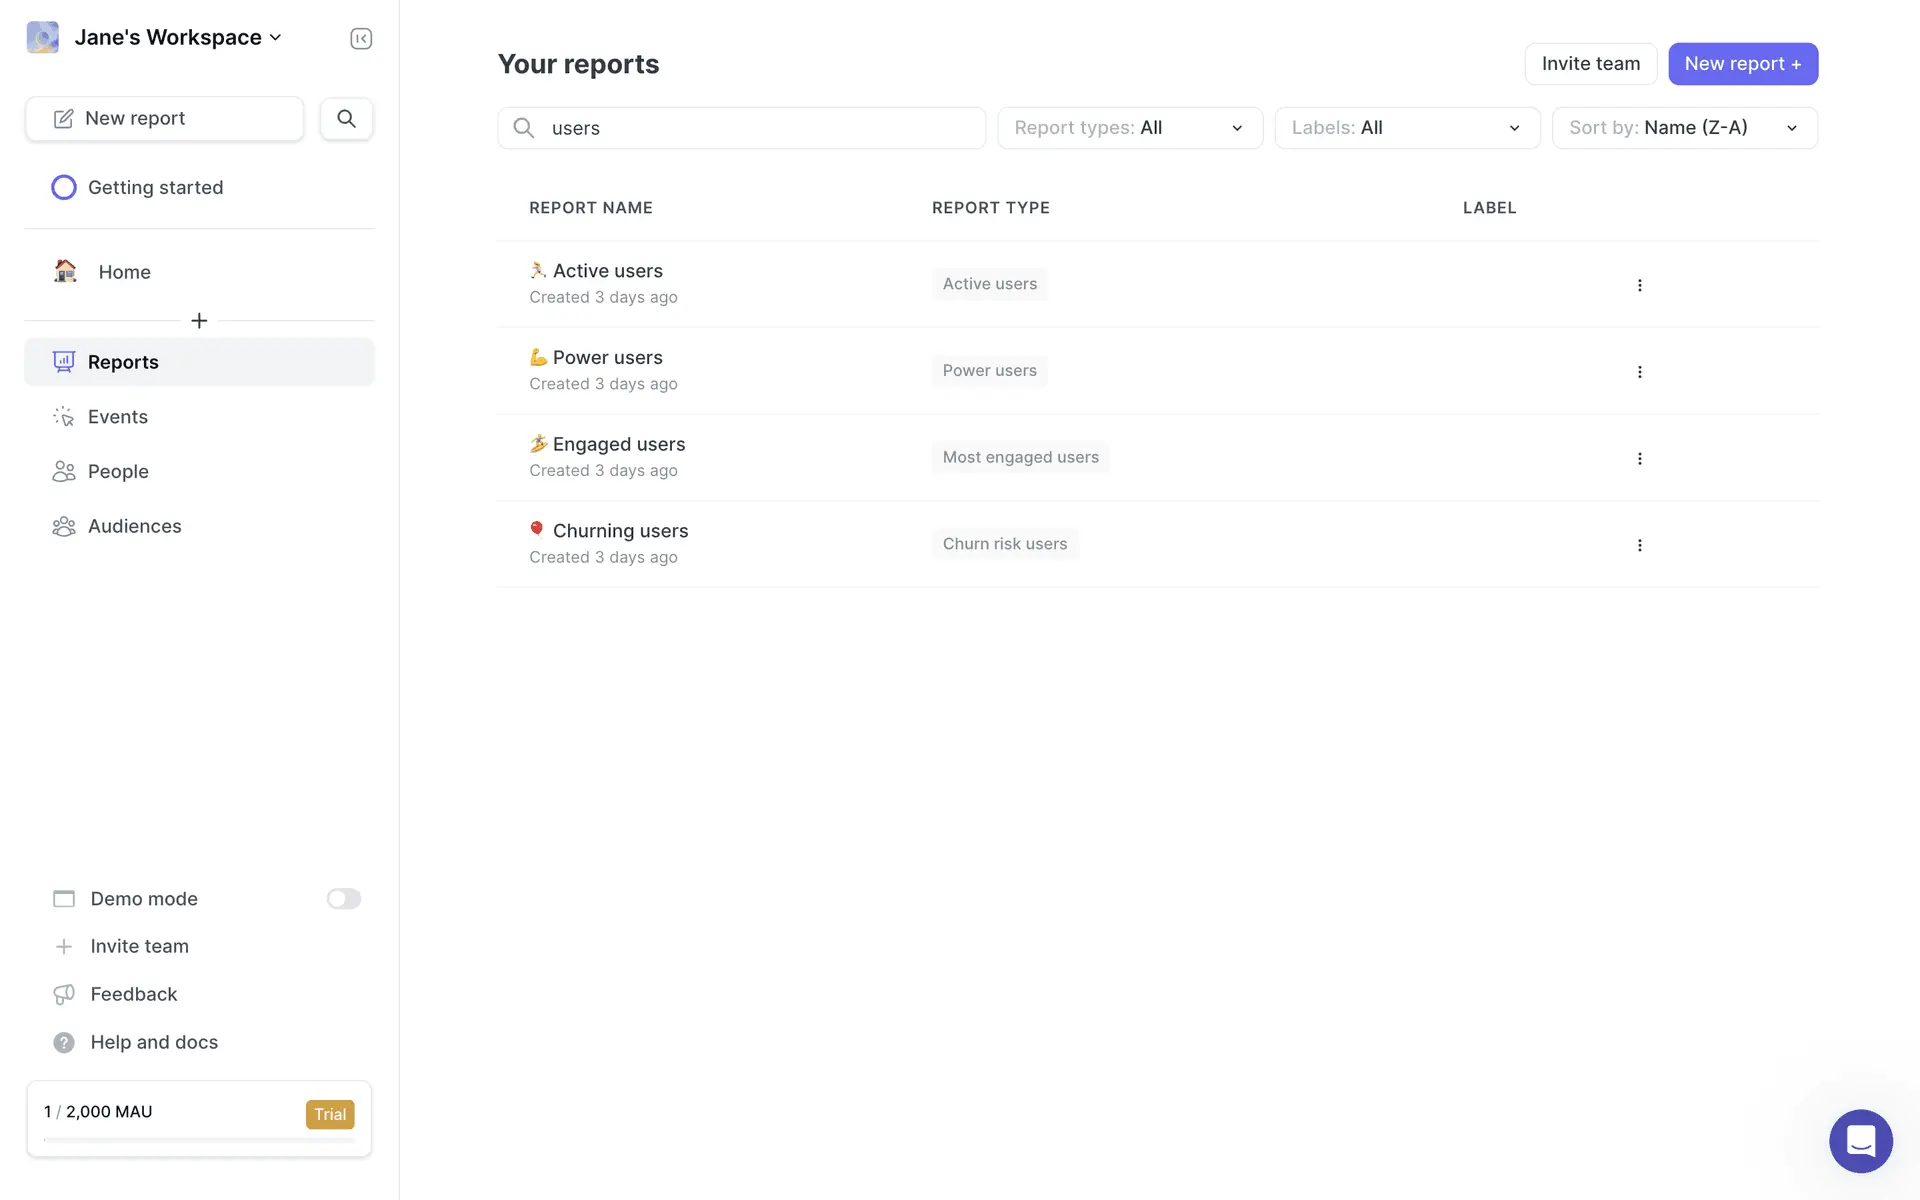
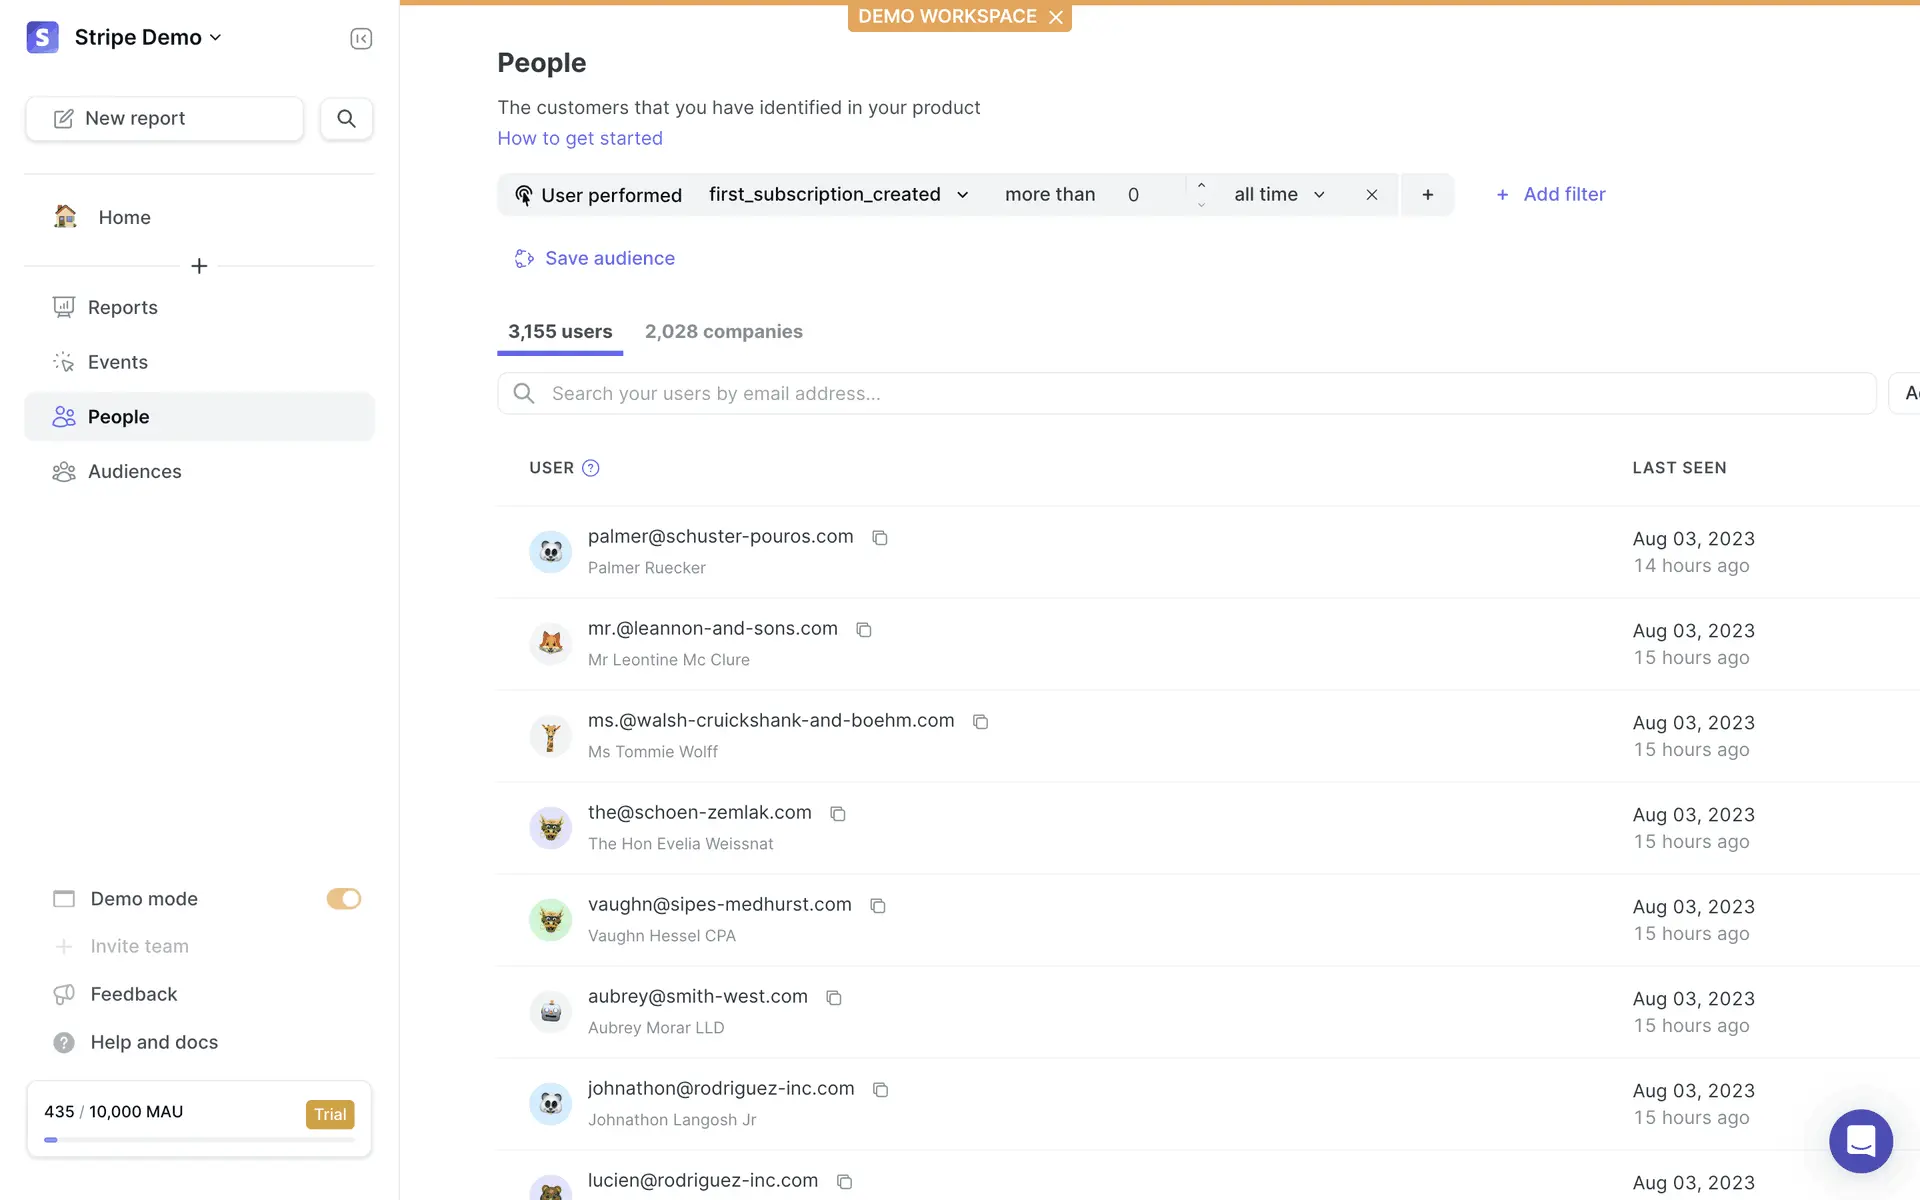
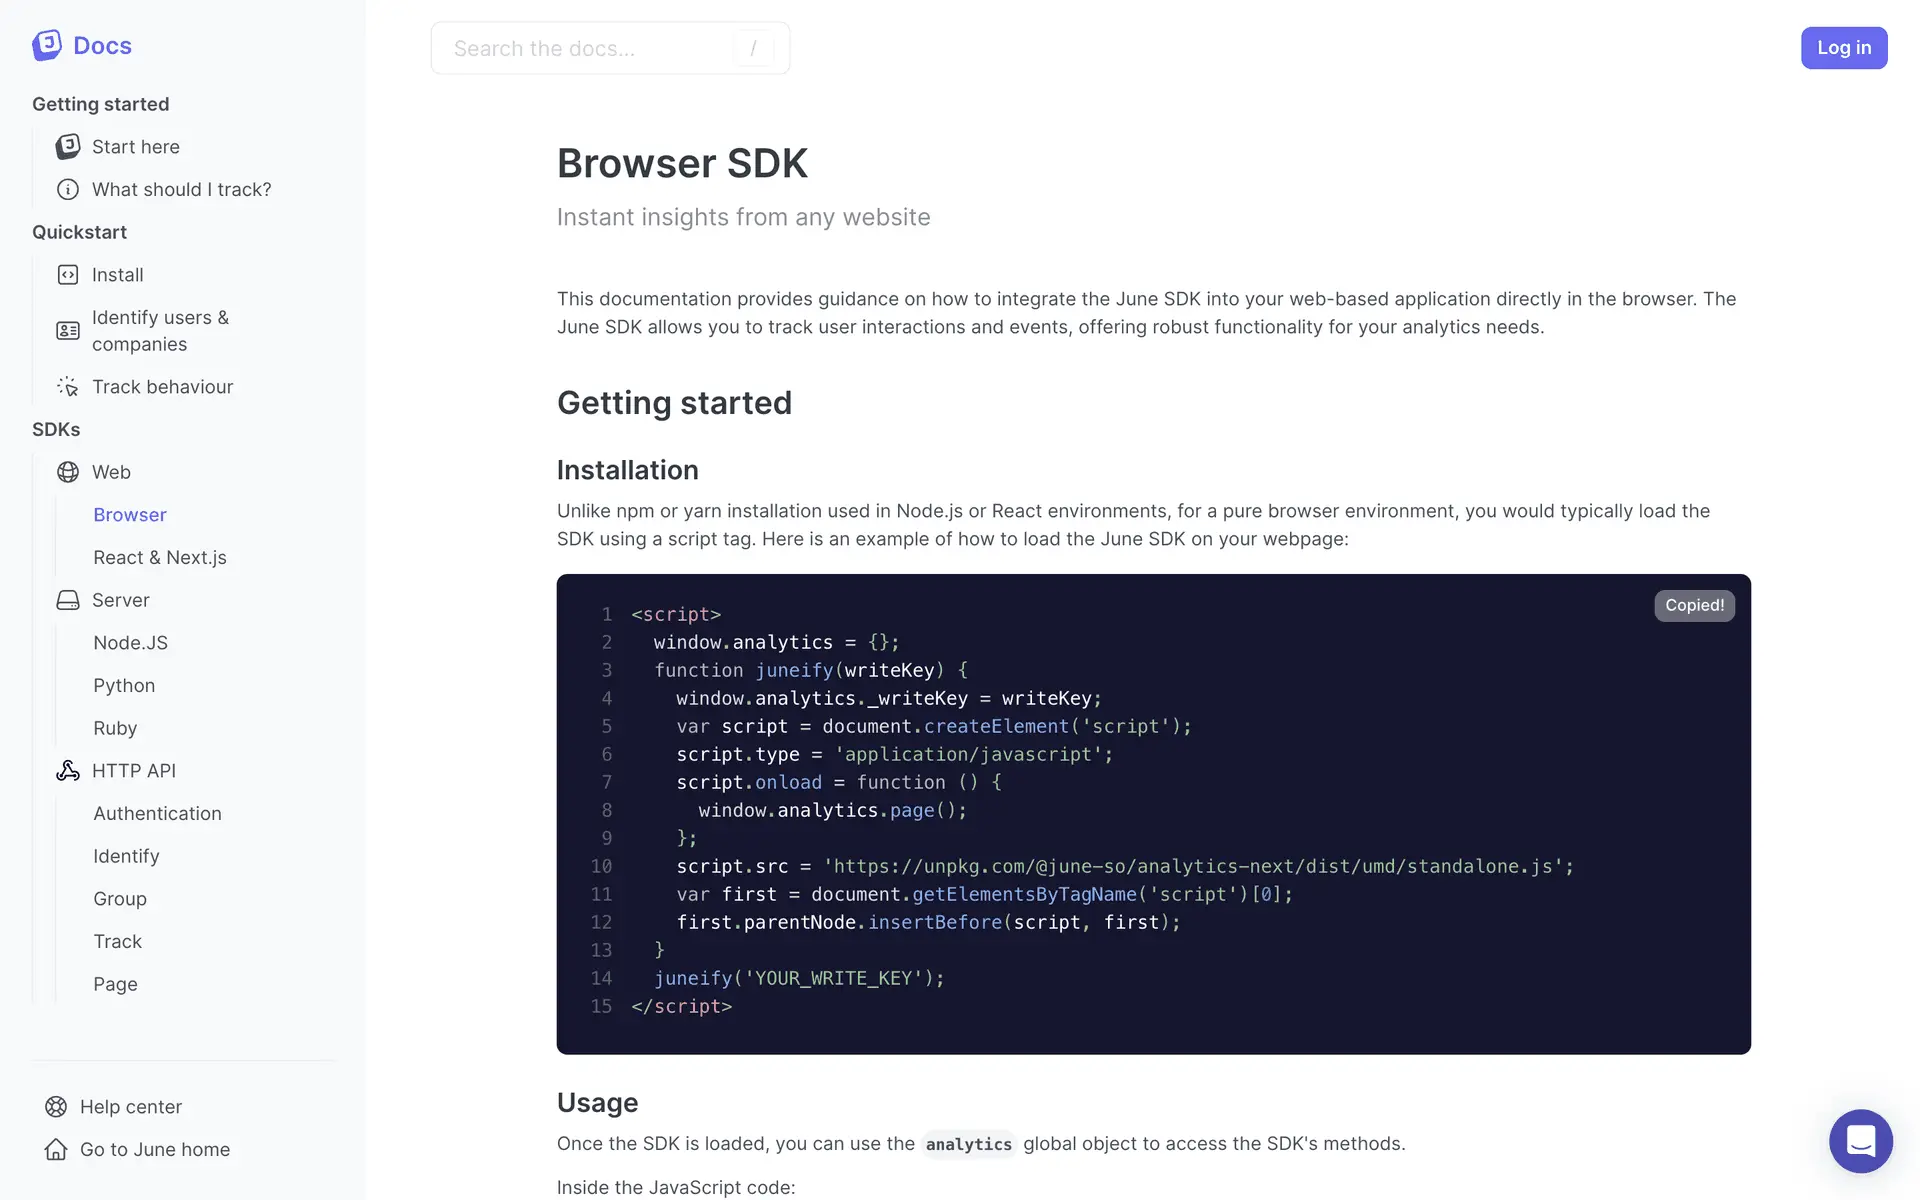
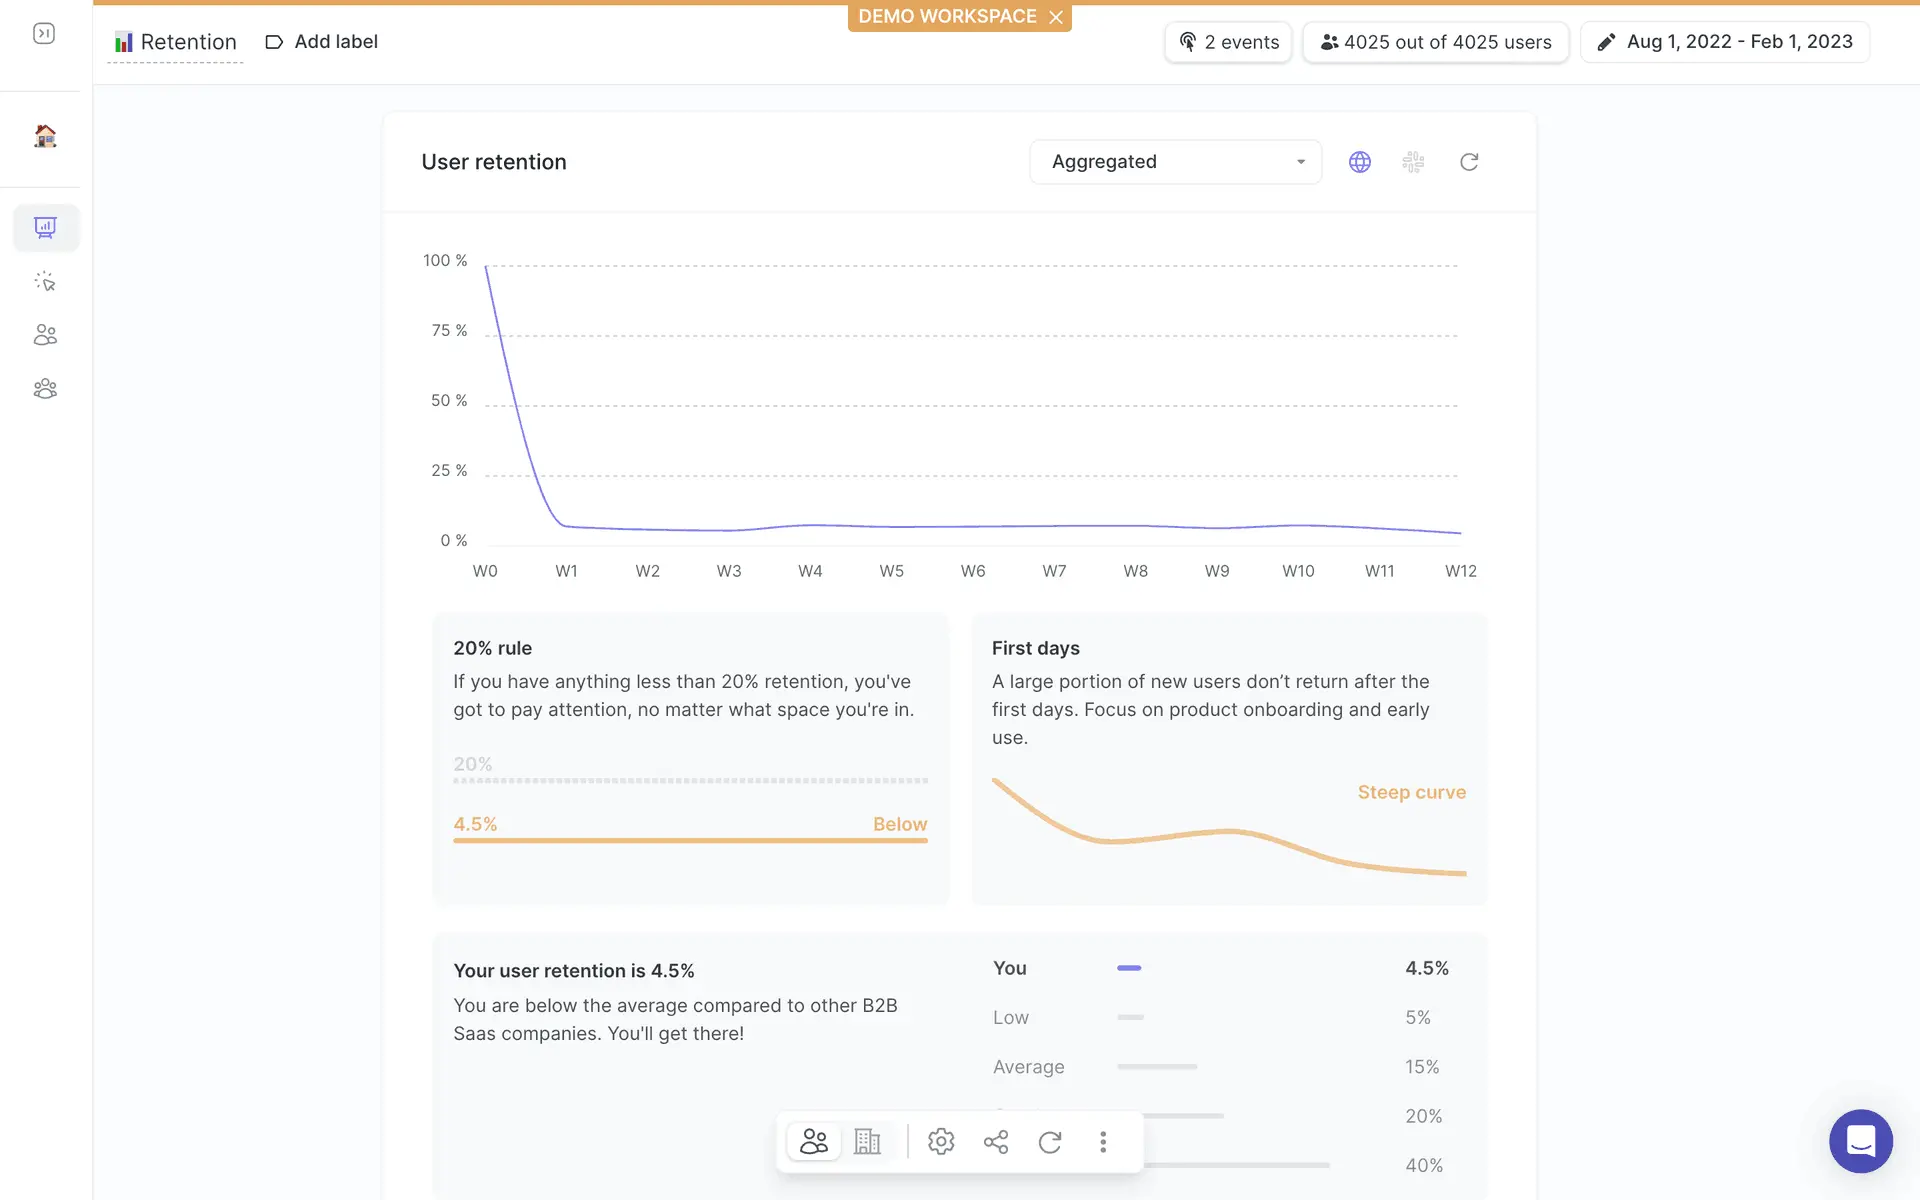
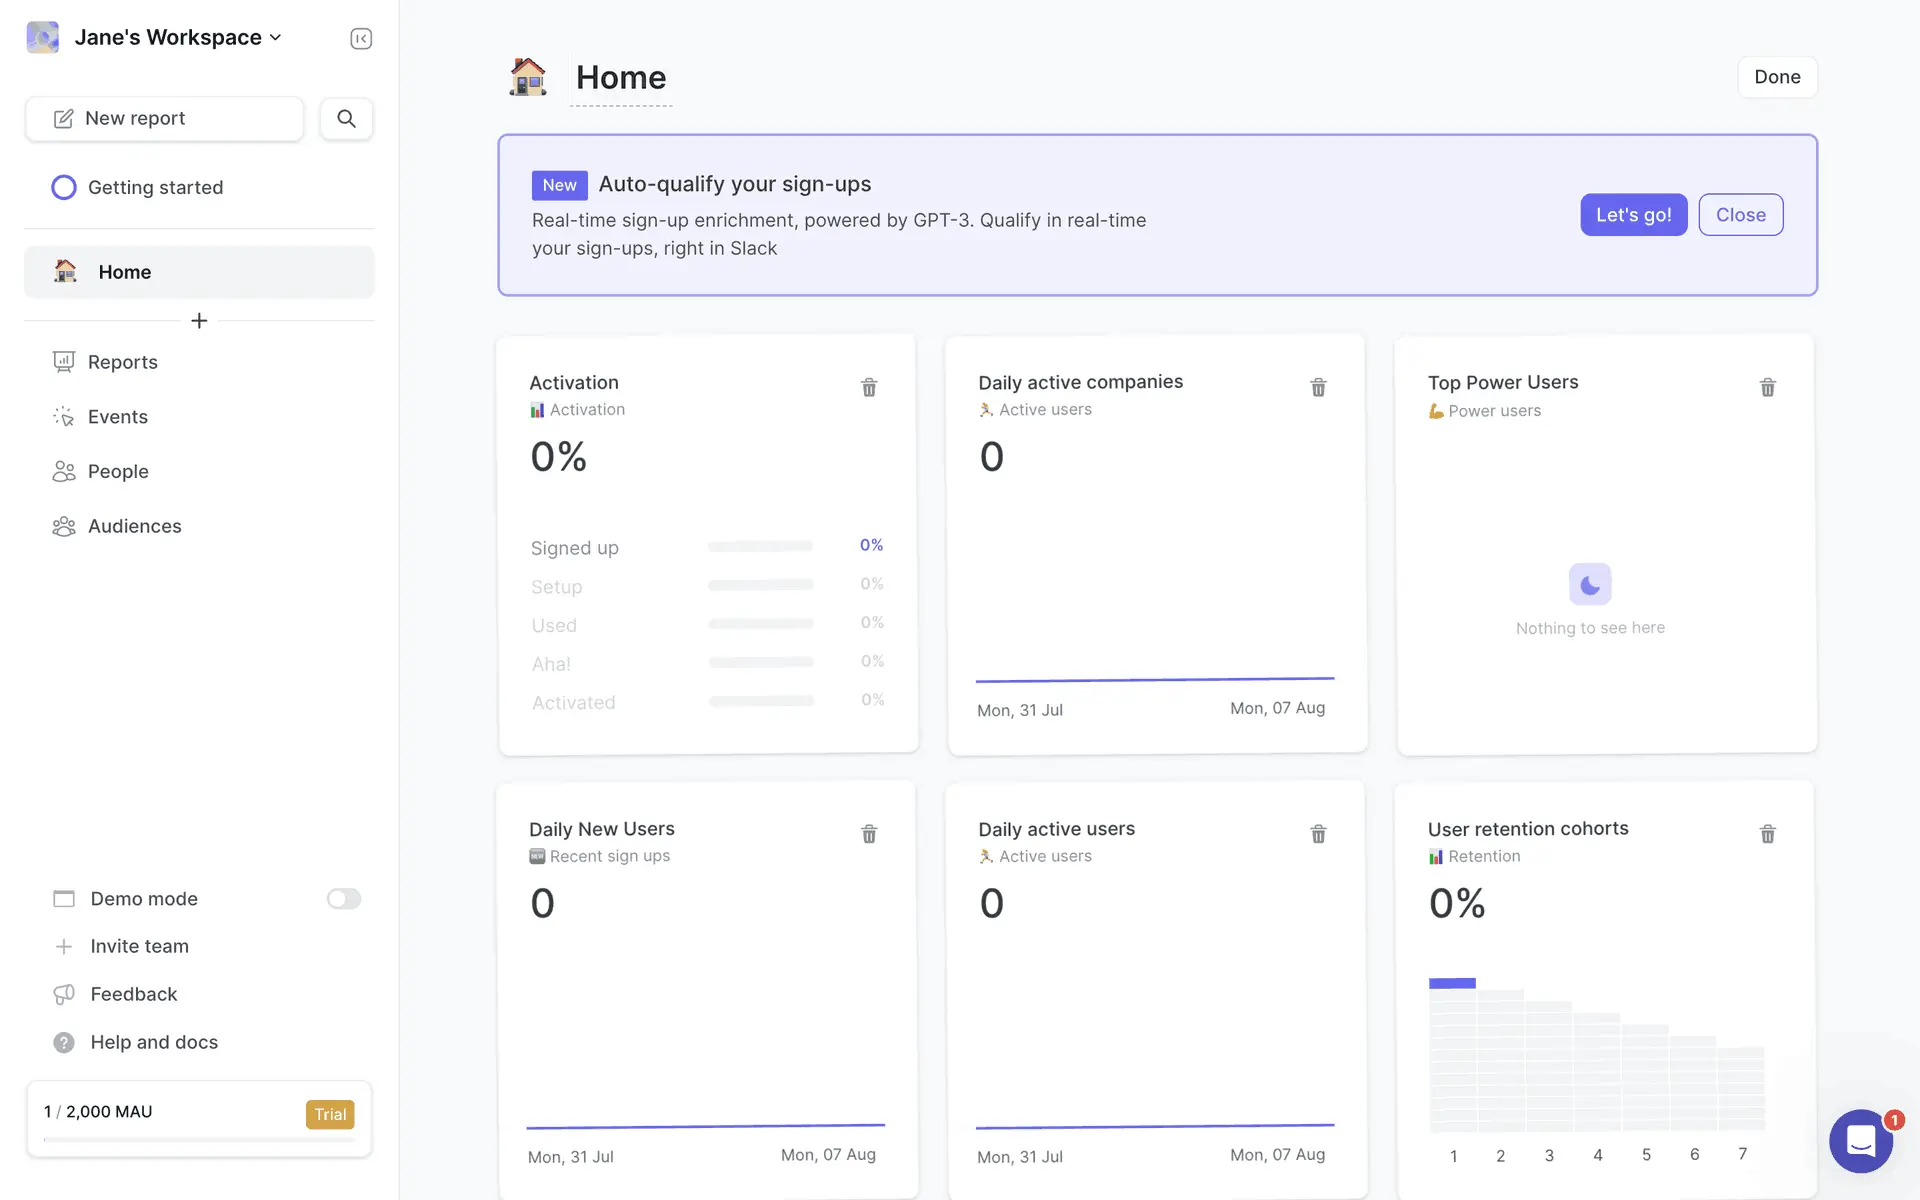
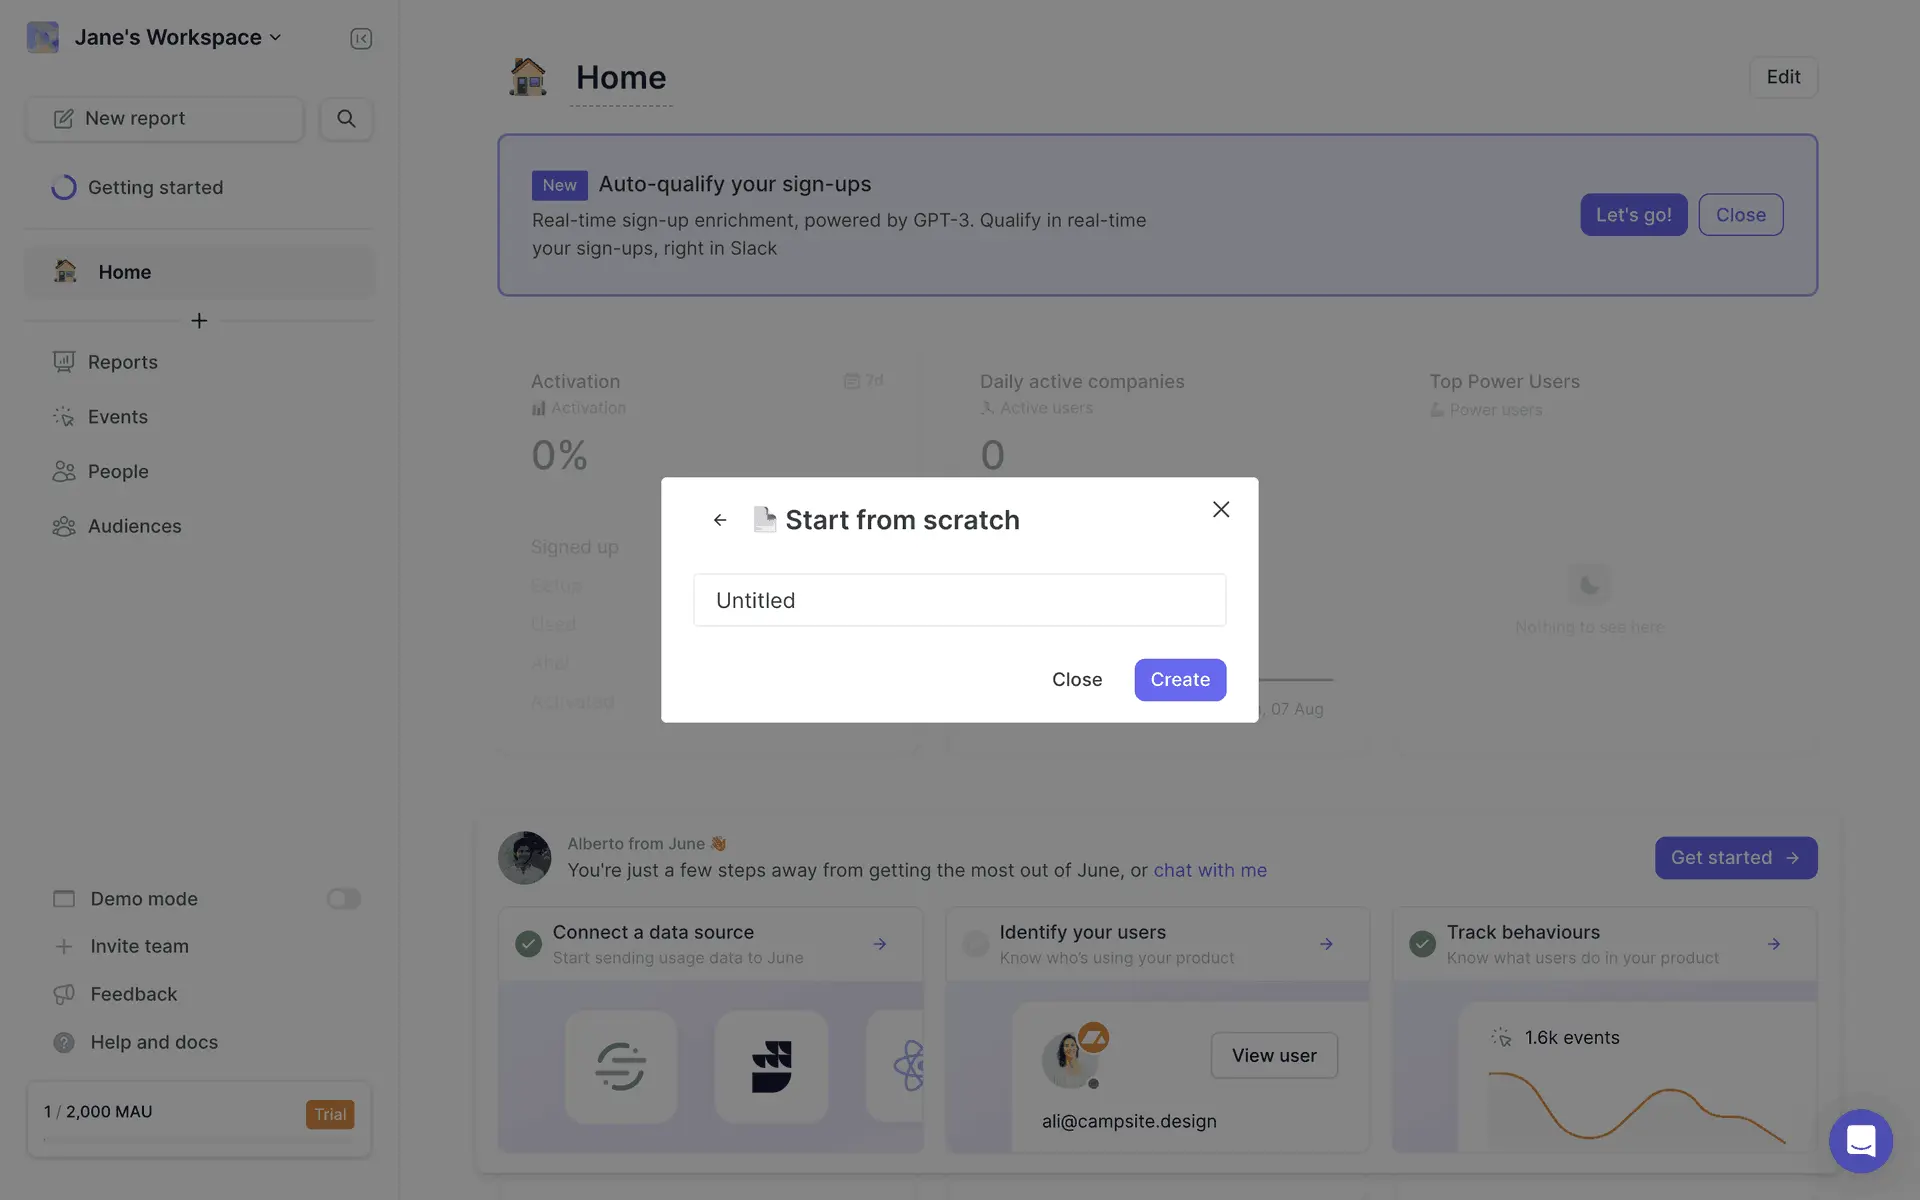
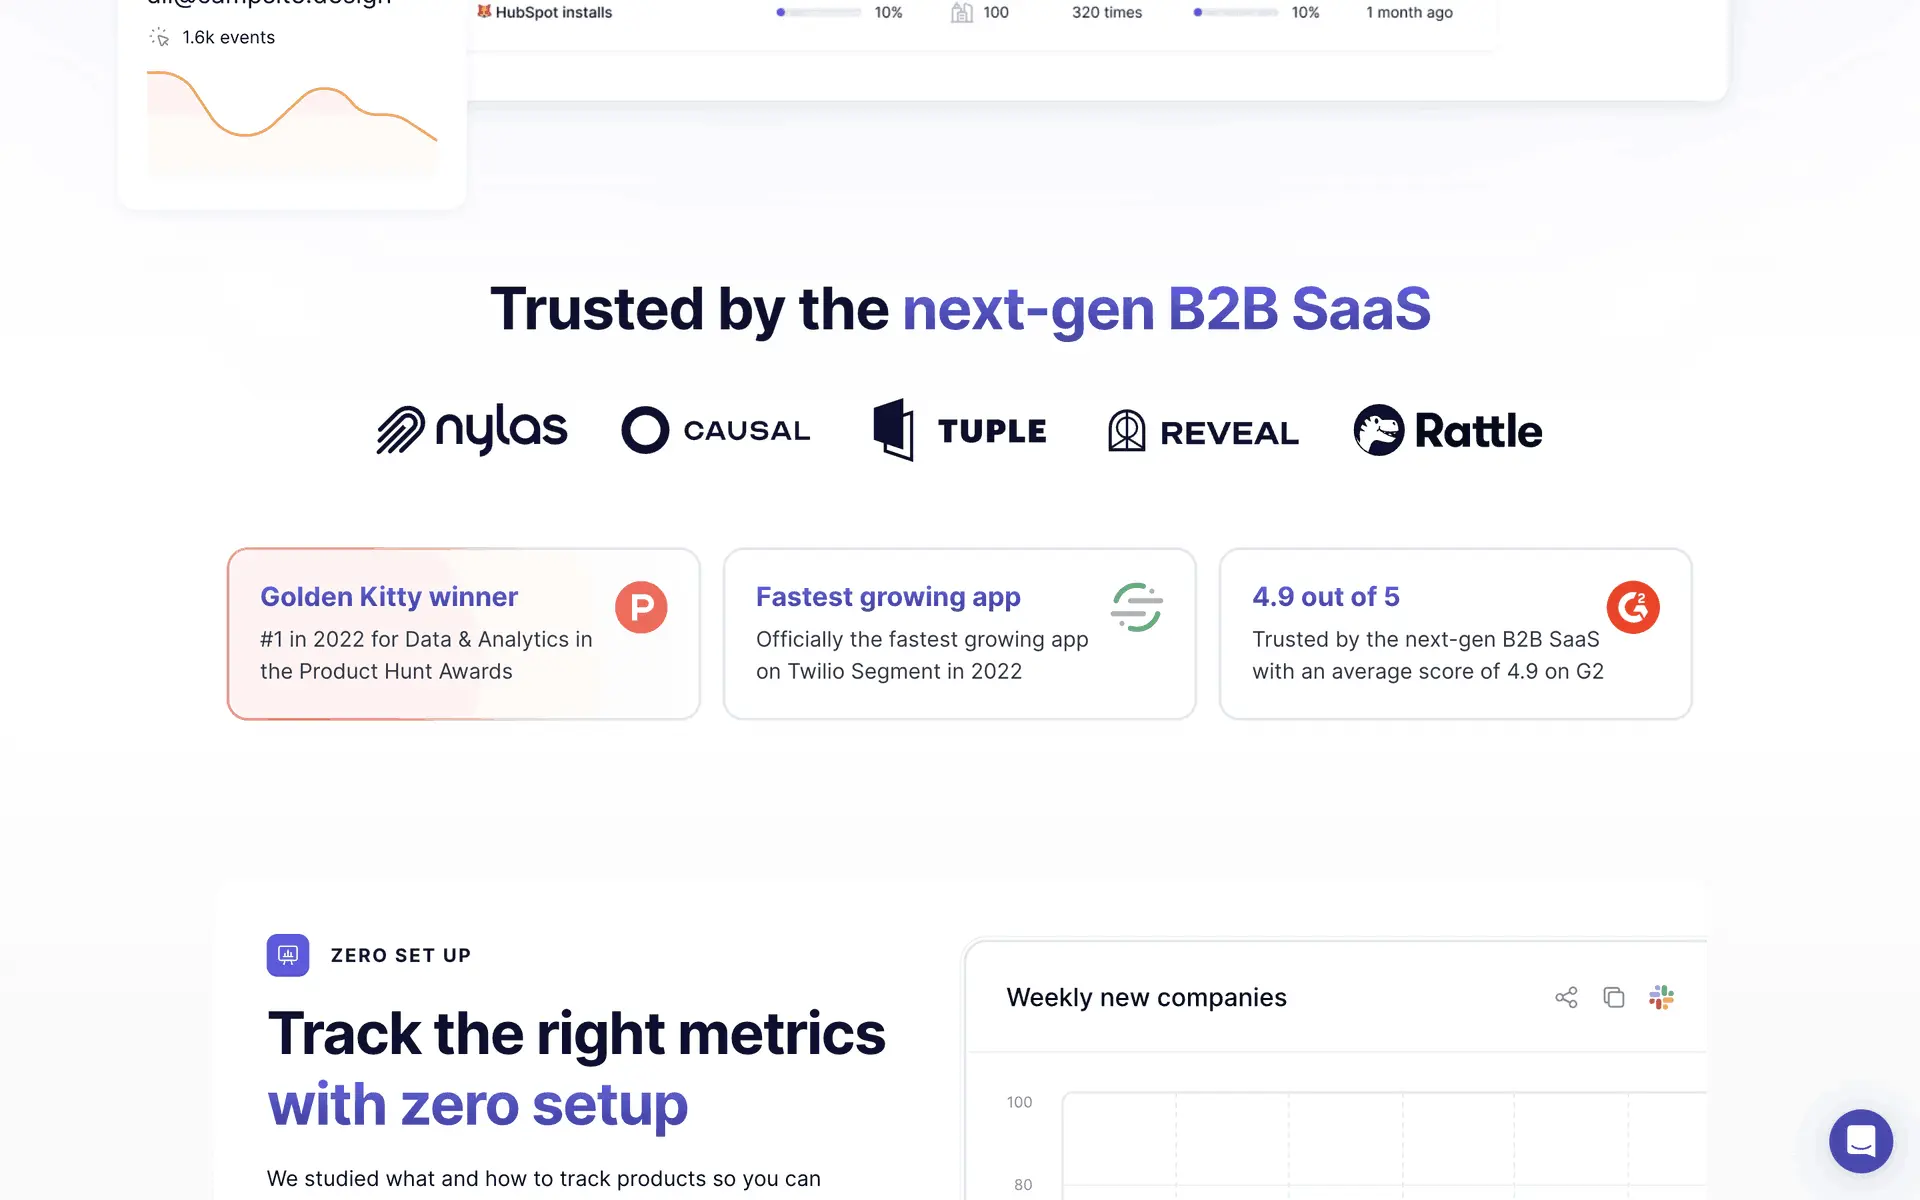
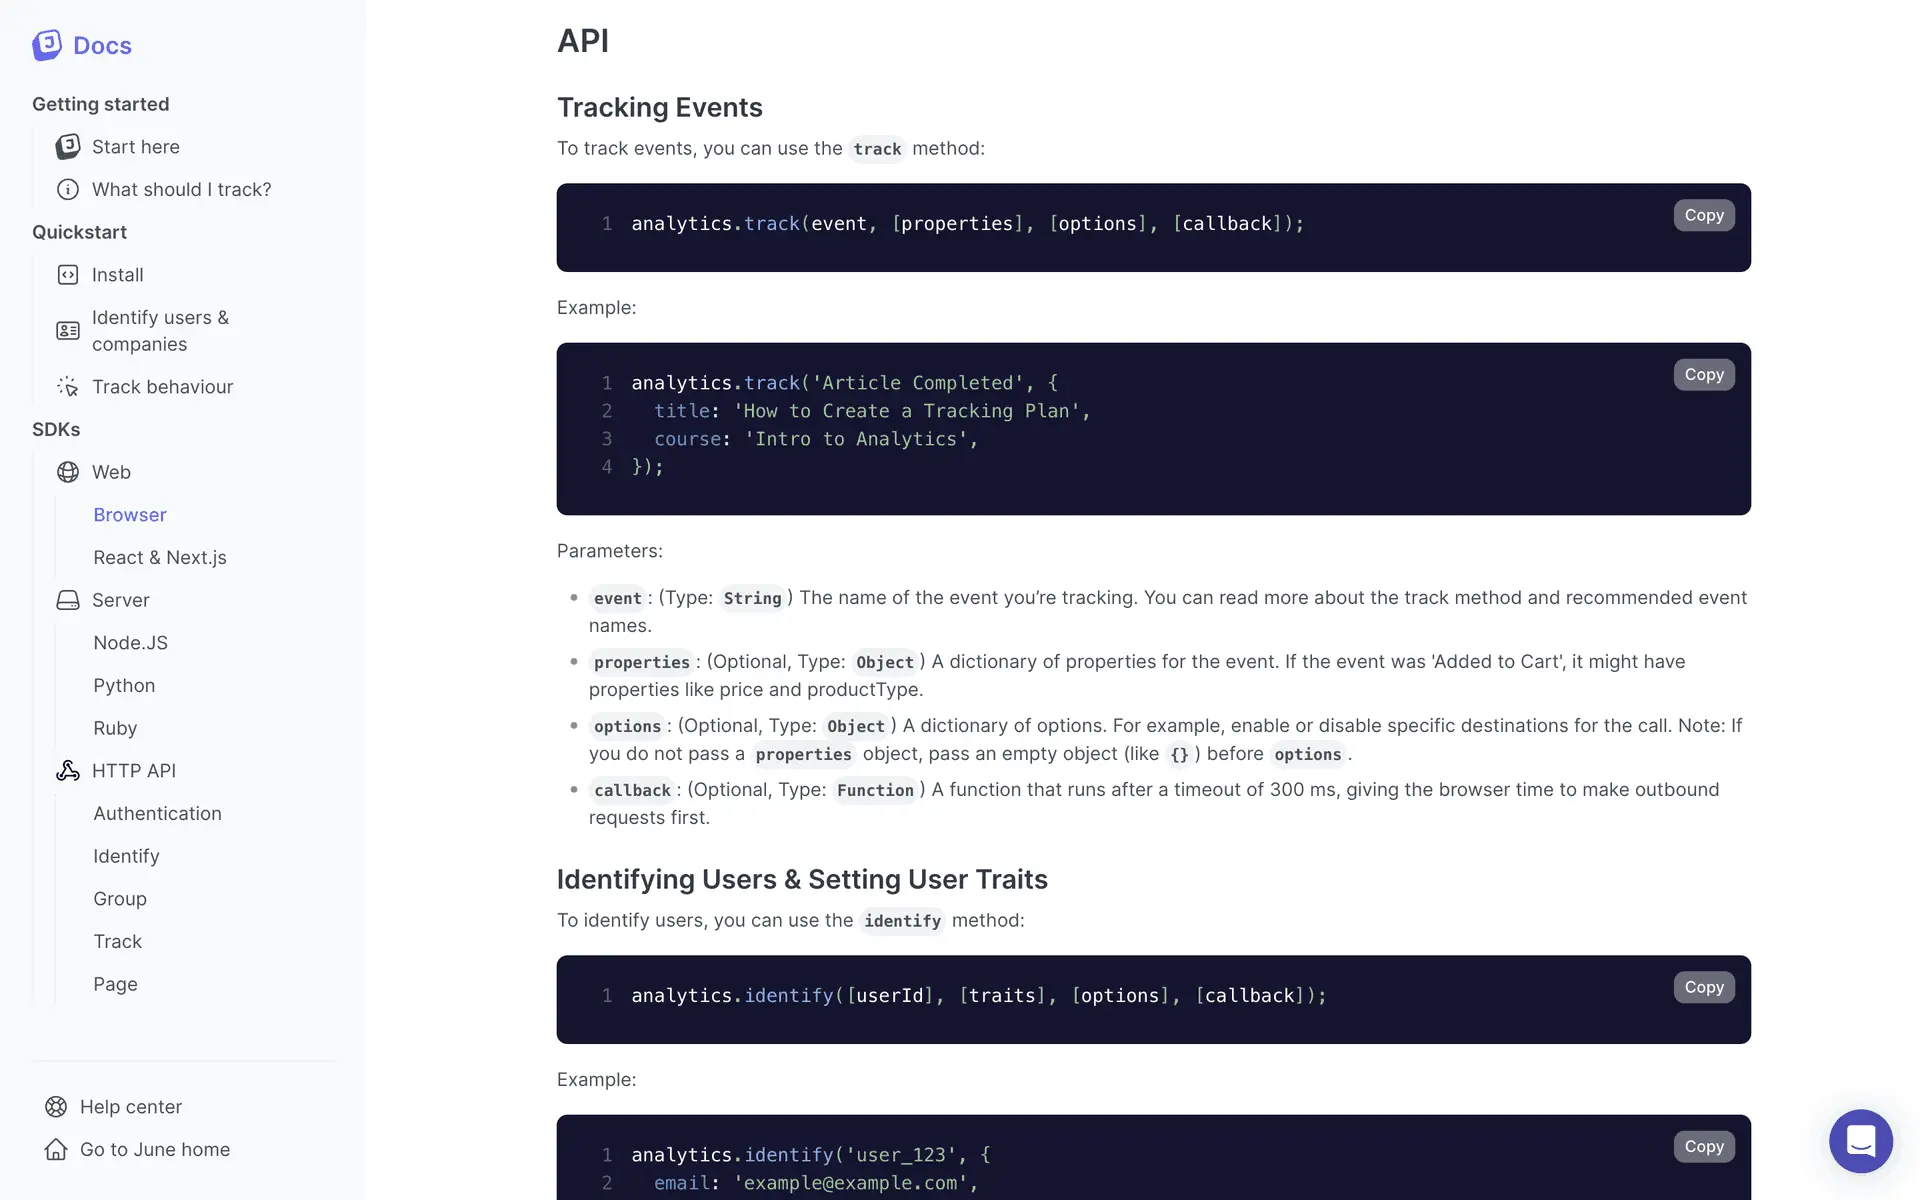
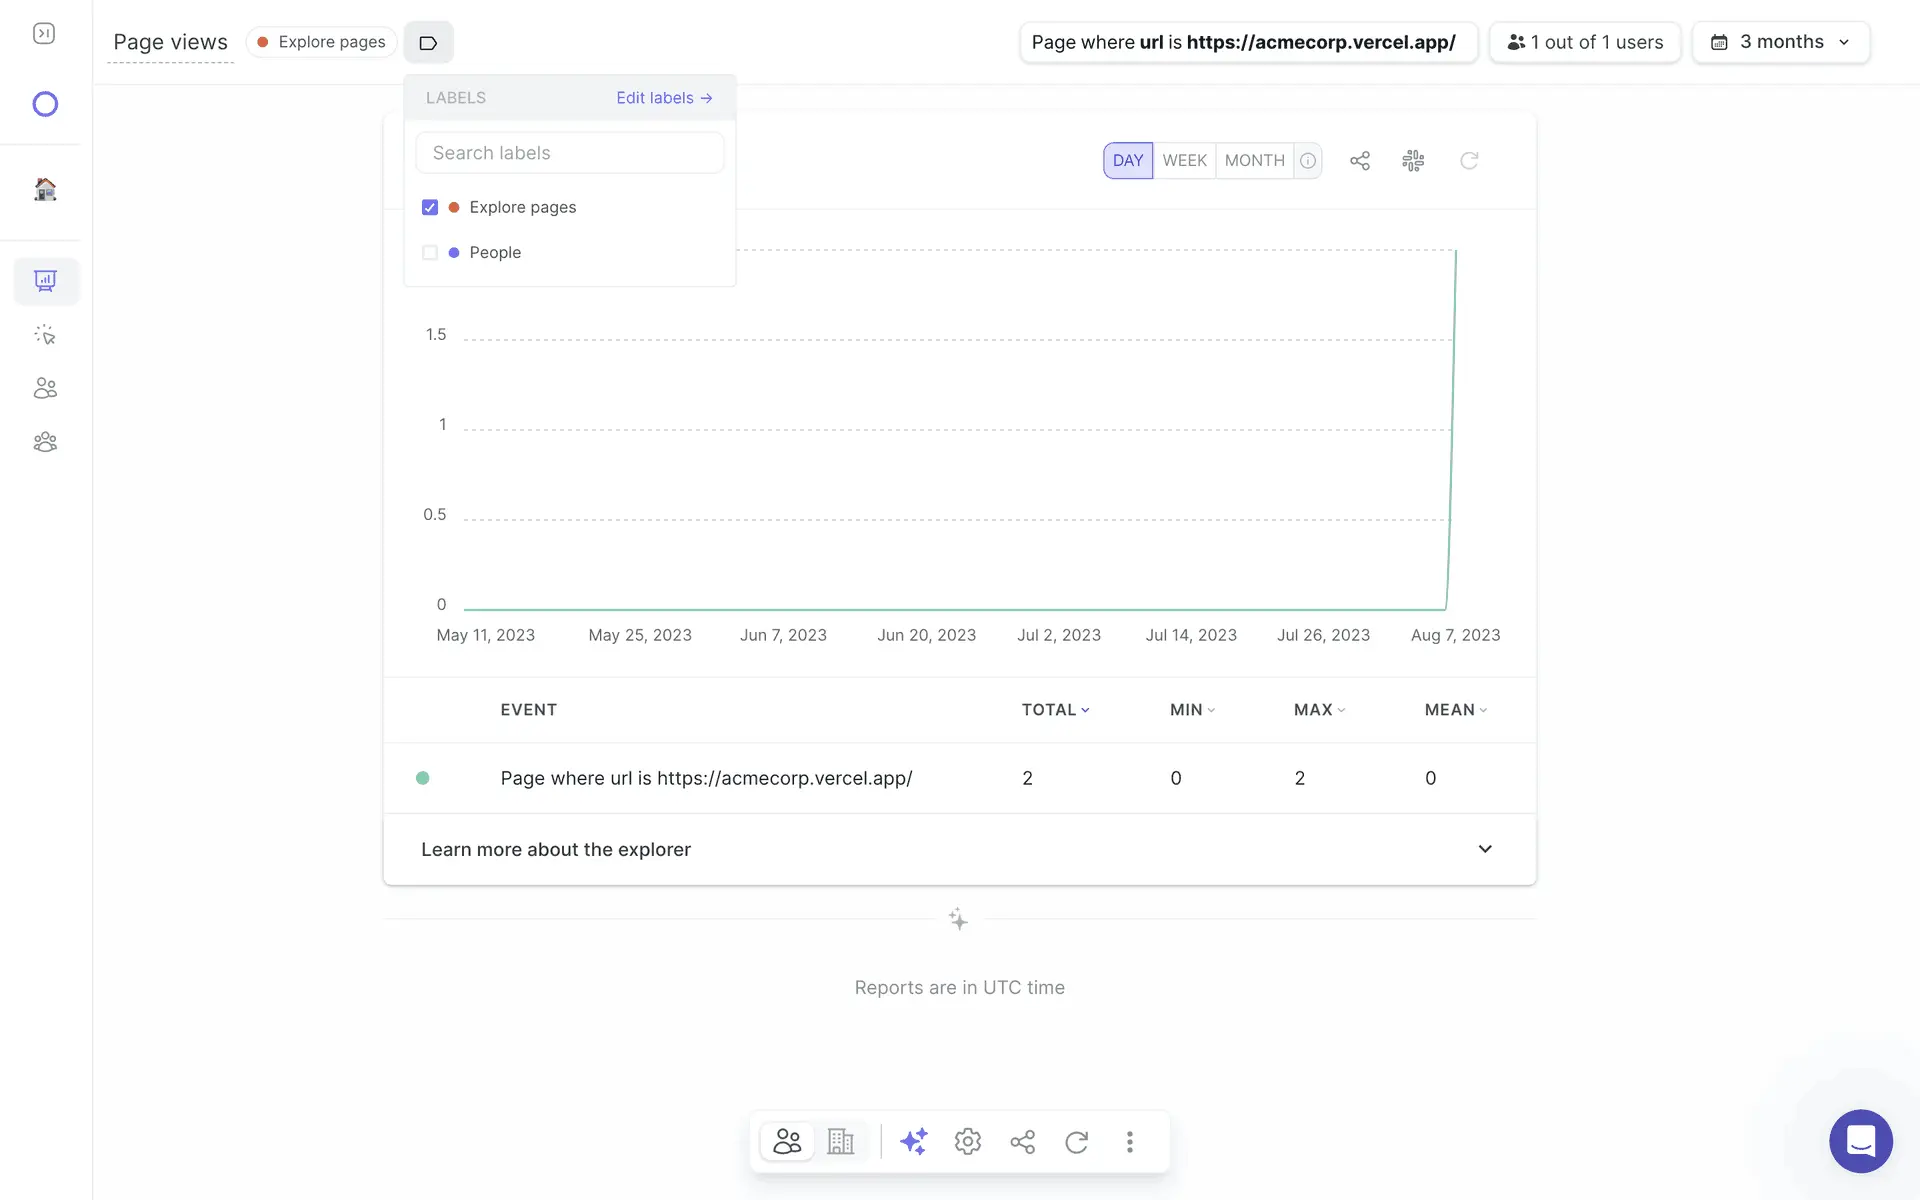
DesignShots contains 363 interface screenshots for June. It is a web app in the Analytics category, which covers data analytics and business intelligence. The frames document product structure, key states and repeated decisions across different parts of the interface. At composition level, the project is tagged with 6 UI patterns: Control panel with metrics and charts, Analytics and data visualization, Data tables with sorting, Side navigation panel and Settings and configuration page. Its extracted palette is led by light tones, with the HEX values displayed on the page. For analysis, compare repeated screen types within June, then open the linked patterns and other Analytics products. This separates a durable interface pattern from a treatment unique to one product. Every figure comes from the published collection; captures filed under older versions are excluded from the current count.
More about JuneHide
Interface Design June
June — a Web App in the Analytics. Data analytics and business intelligence. Product analytics for B2B SaaS. Company-level insights, activation funnels, retention. The interface includes 6 UI patterns: Control panel with metrics and charts, Analytics and data visualization, Data tables with sorting, Side navigation panel, Settings and configuration page, Account login and authentication. The color palette is built on light tones.
UI Patterns in June
FAQ
How many screenshots of June are in the collection?
The collection contains 363 UI screenshots of June, covering key product screens.
What category does June belong to?
June is a Web App in the Analytics category.
How to use screenshots as design reference?
Study UI/UX design solutions for inspiration when designing Analytics products.
The screenshots come from the real product and document the interface as it appeared when captured.